|
The International Air Transport Association (IATA)
today released its monthly statistics for scheduled international airline traffic for December and year 2002.
In the month of December passenger traffic was up 12.7% on the previous year, an increase that was exaggerated by the depressed traffic levels at the
end of 2001. Freight traffic grew by 6.6%, continuing the positive trend seen
during the second half of 2002.
2002 Results
Full year 2002 results show a slight net increase in international passenger
traffic on IATA carriers over 2001 of 0.06%. However passenger capacity fell
by 4.3%, resulting in a 3.3% improvement in the overall passenger load factor
for the year. Freight traffic shows an increase of 6.5% for the year. Overall
capacity (passenger and freight combined) fell by 2.5%.
| International Traffic and Capacity (Percent Change over 2001) |
| |
|
|
|
|
|
|
|
|
|
| Carriers |
RPK |
ASK |
FTK |
ATK |
|
RPK |
ASK |
FTK |
ATK |
| |
(Monthly, December) |
|
(Jan-Dec 2002) |
| |
|
|
|
| Europe |
10.7 |
7.1 |
3.7 |
6.5 |
|
-4.9 |
-8.9 |
0.1 |
-8.4 |
| N. America |
11.1 |
6.9 |
16.1 |
9.3 |
|
-0.9 |
-6.0 |
4.7 |
-3.8 |
| S. America |
19.6 |
7.1 |
16.2 |
-16.2 |
|
6.4 |
4.6 |
4.7 |
1.1 |
| Asia Pacific |
16.7 |
12.8 |
11.3 |
13.1 |
|
5.8 |
1.1 |
13.3 |
3.7 |
| |
|
|
|
|
|
|
|
|
|
| Overall* |
12.7 |
8.0 |
6.6 |
8.5 |
|
0.1 |
-4.3 |
6.5 |
-2.5 |
| |
|
|
|
|
|
|
|
|
|
* figures are provisional - represent total reporting plus estimates for missing data
RPK - Revenue Passenger-Kilometres
ASK - Available Seat-Kilometres
FTK - Freight Tonne-Kilometres
ATK - Available Tonne-Kilometres
Region refers to area of carrier registration
With regard to regional results, Giovanni Bisignani, IATA's CEO and Director
General, highlighted the continuing traffic growth in Asia Pacific. "Asia Pacific
carriers ended the year with encouraging traffic figures compared with other
regions. Passenger traffic grew by 5.8% and freight traffic by 13.3% in contrast
to the results seen for North American and European carriers."
Comparisons with 2000
Since 2001 was an exceptionally bad year, a better idea of overall traffic and
capacity trends is seen from a comparison of 2002 with 2000 on the following
graph. Current passenger traffic levels are averaging a 4.0% decline and
freight a 2.0% decline, on two years ago. |

 Mandarin Oriental Opens Special Hotel in Beijing, China
 AirAsia to Launch Penang - Shenzhen and Kota Kinabalu - Shantou Flights
 Boeing Forecasts Passenger and Cargo Needs of China's Aviation Industry
 Air Corsica Takes Delivery of ATR's 1,700th Turboprop Aircraft
 Minor Hotels to Open Anantara Resort Ubud Bali in October
 Uruguayan Air Force to Add A-29 Super Tucano Aircraft to Fleet
 Air Astana to Increase Flights to Phuket, Thailand; Signs Codeshare Deal with JAL
 Hong Kong Airlines to Resume Long-Haul Flights with Seasonal Gold Coast Service
 IHG Signs Two Hotels in Quang Binh, Vietnam
 Marriott Opens Moxy Hotel in Mumbai, India
 Torsten Richter Returns to Minor Hotels as AGM of Indonesia and Malaysia
 Minor Set to Open World's Third NH Resort in Maldives
 Asiana Airlines and Air Serbia Appoint APG as GSA
 IndiGo to Launch New Delhi - Vijayawada Flights
 Hong Kong Airport Reports Strong Increases in Cargo and Passenger Traffic
 Delta Begins Rollout of Free Wi-Fi on Long-Haul International Routes
 Thai AirAsia X to Resume Flights Between Bangkok and Sydney, Australia
 Marriott Partners Sonder to Add Over 9,000 Rooms to Portfolio
 IHG Opens Hotel Indigo in Bandung, Indonesia
 IndiGo Enhances Operations with Aviobook, an Electronic Flight Folder from Thales
 Boeing Invests in Wagner SAF Refinery in Brisbane, Australia
 Aeroflot to Resume Flights Between Yekaterinburg and Bangkok, Phuket and Goa
 Air Astana Takes Delivery of 56th Aircraft; Confirms Plan to Launch Phu Quoc Flights
 Seibu Prince Rebrands Hotel in Singapore
 airBaltic Appoints APG as GSA in Egypt
 Korean Air and Delta Air Lines Partner Habitat for Humanity to Make a Difference in Cheonan
 Air New Zealand, Garuda, Qantas and Singapore Airlines Begin UPR Trials on 38 Routes
 Thai AirAsia Reports Q2 and H1 2024 Results; Confirms Full-Year Targets
 EL AL Israel Airlines Finalises Deal for 31 Aircraft
 Cebu Pacific to Launch Davao - Hong Kong and Iloilo - Singapore Flights
 Poland to Become Largest Operator of Apache Combat Helicopters Outside of USA
 Singha Estate Partners Ascott for Rebranding of Two Hotels in the United Kingdom
 IndiGo to Launch Coimbatore - Singapore Flights; Increase Frequency of Select Services
 Parveen Kumar Joins Grand Hyatt Jakarta as General Manager
 Azerai Appoints Jimmy Tran as Group Director of Sales & Marketing
 South Korea to Strengthen Airborne Surveillance and Reconnaissance Capabilities
 Virgin Australia to Replace Fokker 100s with Embraer E190-E2 Aircraft
 Cross Adds Two Hotels in Bangkok, Thailand to Portfolio
 airBaltic Exercises Options on 10 Airbus A220-300 Aircraft
 Etihad to Increase Thailand Flights; Resume A380 Service to Singapore
 Dusit Signs Hotel and Condo on Rama 3 Road in Bangkok, Thailand
 Cape and Kantary Hotels to Expand Portfolio with Serviced Suites in Korat, Thailand
 Thai Airways Reports Q2 and H1 2024 Results
 China Airlines Extends Cargo Handling Contract with FCS
 Goldfinch Becomes First Piloted Electric Aircraft to Fly at NASA's Langley Research Center
 Rosewood Signs Luxury 33-Suite Resort in Exuma, Bahamas
 British Airways Expands Codeshare with Bangkok Airways
 Aeroflot Unveils Most Popular International Destinations in H1 2024
 Marriott Executive Apartments Open on Sukhumvit Soi 49 in Bangkok, Thailand
 Uday Rao Appointed RVP and GM of Four Seasons Hotel Tokyo at Otemachi in Japan
 CapitaLand Ascott Trust Secures OCBC 1.5°C Loan
 Sabre Hospitality Enhances SynXis Booking Engine with Trip Protection Services
 Cathay Pacific Orders 30 Airbus A330-900 Aircraft
 Haytham Said Appointed GM of Four Seasons Hotel Miami
 Hong Kong Airport Launches World's First Smartphone Express Bag Drop Service
 Marriott Signs W Hotel in Hangzhou, China
 IndiGo Selects Recaro's R2 and R5 Seats for New A321neo Aircraft
 Scoot to Take Delivery of Jalan-Jalan and Travel Kaki E190-E2s in September and October
 Ali Mohammed Appointed Regional Vice President and GM of Four Seasons Resort Orlando
 Marriott Opens Fourth Executive Apartments Property in Bangkok, Thailand
 AirAsia X to Resume Kuala Lumpur - Chongqing Flights
 Norse Operates Non-Stop Charter Flight from Oslo to Darwin, Australia
 Wyndham Reports Record H1 Growth in Asia Pacific
 LOT Polish Airlines Takes Delivery of First Embraer E195-E2
 Vietnam Airlines Takes Delivery of Fifth Boeing 787-10 Aircraft
 Marriott Expands Executive Apartments Brand to Penang, Malaysia
 AirAsia Group Expands Fleet with Four Airbus A321neo Aircraft
 IATA Reports Latest Airline Passenger Traffic Data
 China Airlines Signs SAF-Related MOU with Morrison Express
 Fairfield by Marriott Hotel Opens in Terengganu, Malaysia
 IATA Reports Latest Global Air Cargo Data
 Marriott Opens Fifth Autograph Collection Hotel in Japan
 Matthew Smith to Succeed Monique Arnoux as CEO of Destination Asia
 American Airlines Renews Subscription to Prism
 Shanghai Pudong Airport Installs 52 Kiosks and 14 Self-Service Bag Drops from SITA
 Hong Kong Airport Handled 4.3 Million Passengers and 29,590 Flight Movements in June
 Croatia Airlines Takes Delivery of First Airbus A220
 Ryanair to Implement Boeing's Jeppesen FliteDeck Pro 5.0 EFB
 Asia Pacific Airlines Carried 28.9 Million International Passengers in June
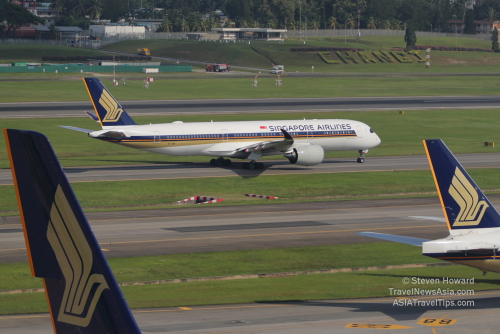 Singapore Changi Airport Reports Q2 2024 Traffic
 Cat Wu Returns to Singapore as Executive Director of Revenue for Two Hotels
 Langham Appoints Jack Xiao as Senior Vice President of Operations - China
 NATO Selects Sikorsky X2 Rotorcraft for Integrated Platform Concept Study
 Malaysia Airlines Expands Retailing Strategy with NDC Content on Travelport
 Air Tahiti Orders Four ATR 72-600 Aircraft
 One Air to Expand Fleet with Third Boeing 747-400 Freighter
 FCM Travel Expands Cytric Distribution Agreement with Amadeus
 Cathay Pacific Expands 1 Ticket, 1 Tree Initiative to Include Cargo
 Japan Airlines Confirms Order for 20 Airbus A350-900s and 11 A321neos
 Embraer E190 Freighter Receives ANAC Type Certification
 Libya's Berniq Airways Orders Six A320neo Family Aircraft
 Qatar Airways Adds 20 Boeing 777-9s to Order Book
 Accor Signs Raffles Hotel in Tokyo, Japan
 Thai AirAsia to Launch Bangkok - Hyderabad and Phuket - Siem Reap Flights
 Courtyard by Marriott Hotel Opens in Sapporo, Japan
 Qatar Airways Unveils Qsuite Next Gen at Farnborough Airshow 2024
 British Airways Increases Number of Funded Places in Speedbird Pilot Academy
 Mandarin Oriental Signs Hotel and Residences in Bali, Indonesia
 Minor Hotels Signs Dual-Branded Property in Yining, China
 Korean Air Takes Delivery of First Boeing 787-10 Dreamliner
 Two Senior Promotions at IHG Asia Pacific
 Miss International Queen 2024 (MIQ 2024) - Interview with Alisa Phanthusak, MD, Tiffany's Show Pattaya, Thailand
 Airbus A321XLR Powered by CFM LEAP-1A Engines Receives EASA Type Certification
 New Dusit Thani Bangkok Hotel to Open 27 September 2024
 CWT Upgrades Airfare Optimization Service with AI and Machine Learning
 Small Luxury Hotels of the World Returns to India with MRS Group Partnership
 SATS and SF Group Sign MOU to Expand Global Footprint
 Thai AirAsia to Launch Don Mueang - Lampang Flights
 Hong Kong Welcomed 3.13 Million Visitor Arrivals in June 2024
 China Airlines Launches Direct Flights Between Taipei and Seattle, USA
 London Heathrow Airport Expands Partnership with SITA
 bp Partners Audi Formula 1 Team
 Qantas Launches Non-Stop Flights Between Perth and Paris, France
 Marriott Signs First Ritz-Carlton Reserve in UAE
 Vietnam Airlines to Launch Flights Between Hanoi and Phnom Penh, Cambodia
 Saudia and flyadeal Increase Flights to Abha; Group Reports Positive H1 Numbers
 SITA Completes Legal and Regulatory Formalities for Materna IPS Acquisition
 Marriott Opens AC Hotel in Gunpo City, South Korea
 Air France-KLM Signs Codeshare and Interline Agreements with Scandinavian Airlines
 IHG Signs Four Hotels in Spain
 Entries Open for 2025 New Zealand Millennium Cup Regatta
 American Airlines to Develop Aviation Maintenance Talent Pipeline with Tulsa Tech
 IHG Signs First Vignette Collection Hotel in Almaty, Kazakhstan
 Hahnair Partners German Formula 1 Driver, Nico Hülkenberg
 Travelport Enhances Platform with AI and ML-Powered Content Curation Layer
 Cotai Water Jet to Launch Macau Fireworks and Sightseeing Cruises
 United Airlines Applies to Launch New Daily DCA - SFO Service
 Luminara, a Ritz-Carlton SuperYacht, to Cruise Asia Pacific in 2025-26
 Afrijet Appoints APG as GSA in South Africa
 Euros 2024 a Record-Breaking Success for Hotels in Cologne, Germany
 Etihad Airways to Increase Flights to Boston, USA; Operate A350 on Toronto Service
 Saudi Arabia Orders Four A330 Multi Role Tanker Transport Aircraft from Airbus
 Ascott Becomes Official Global Hotels Partner of Chelsea FC; Will Take Over Stadium Hotels
 Indochina Kajima Gets Green Light for Construction of Mandarin Oriental Bai Nom in Vietnam
 Rahul Dangwal Joins Amora Riverwalk Melbourne; Rob Unson Joins Amora Brisbane
 Air Canada Signs Deal for Eight Boeing 737-8 Aircraft
 Cebu Pacific Takes Delivery of 7th Aircraft of the Year
 SITA Reports Record Results; Future of Air Travel - Podcast and Video Interview with Sumesh Patel, President of SITA Asia Pacific
 Vietnam Airlines Takes Delivery of First Airbus A320neo
 Marriott Opens 100th Sheraton Hotel in Greater China
 Syahreza Ishwara Appointed GM of Anantara Koh Yao Yai Resort & Villas in Thailand
 Tiong Nam Hospitality Adds Marina in Puteri Harbour, Malaysia to Portfolio
 Sabah Tourism Board Signs 5-Year Agreement with AirAsia
 Turkish Airlines to Expand Cargo Fleet with Four Boeing 777 Freighters
 Zurich Airport to Trial Security Solutions from Smiths Detection
 IATA Reports Global Air Cargo Data for May 2024
 AirAsia Launches KL - Sihanoukville Flights; Confirms KL - Labuan Bajo Service
 Inaugural Tourism Seasonality Summit to Take Place at Routes World 2024 in Bahrain
 Hahnair Adds 10 Airlines to HR-169 Ticket Solution
 WFS Opens Fifth Cargo Terminal at Adolfo Suarez Madrid-Barajas Airport in Spain
 Four Senior Appointments at New Dusit Thani Bangkok Hotel
 Onyx Opens First Shama Hotel and Serviced Apartments in Malaysia
 IHG Signs First Hotel in Kashmir
 World's Largest Aloft Hotel Appoints Tan Kim Seng as General Manager
 AirAsia X to Launch Flights Between Kuala Lumpur and Nairobi, Kenya
 Minor Signs Deal to Rebrand Peace Resort Samui as NH Collection Samui
 Thai Airways Resumes Flights to Milan and Oslo
 Kylie Minogue to Perform at Mandarin Oriental Bodrum's 10th Anniversary Party
 Eve Air Mobility Raises US$94 Million in New Equity Financing
 Thai AirAsia Launches Suvarnabhumi - Hat Yai Flights
 Jesper Larsen Returns to Vietnam as GM of InterContinental Halong Bay Resort and Residences
 Six Key Appointments at Ascott
 Finnair Completes Long-Haul Cabin Renewal
 AirAsia to Launch Flights Between Kuala Lumpur and Chiang Rai, Thailand
 Thai Airways Expands Partnership with Amadeus
 Asia Pacific Airlines Carried 27.9 Million International Passengers in May
 Korean Air Cargo Expands SAF Program with CEVA Logistics Partnership
 IHG Signs First Holiday Inn Express Hotel in Egypt
 Ticket Booking Opens for World Travel Market 2024 in London
 Spotnana Enhances Service with Sabre's NDC Content
 Codeshare Flights Between Kuwait and Thai Airways Take Off
 Singapore Airlines Extends Cargo Handling Contracts with WFS
 Courtyard by Marriott Hotel Opens Near Colva Beach in Goa, India
 Air Mauritius Joins AirAsia Move OTA
 LOT Polish Airlines Appoints APG as Online GSA in Saudi Arabia
 Onyx Hospitality Expands Shama Hub Brand to Hangzhou and Hong Kong
 Minor to Take Over Management of Iconic Hotel in Bangkok, Thailand
 Singapore Airlines to Launch Flights to Beijing Daxing; Increase Beijing Capital Service
 Marriott Opens Fourth Courtyard Hotel in Malaysia
 Momentus Hospitality Appoints Chow Keng Hai as General Manager
 Helicopter Designed for French Special Forces Begins Flight Tests
 Westin Resort Opens in Cam Ranh, Vietnam
 Google Wallet Compatibility Added to Vingcard's Digital Key Solution, Mobile Access
 Cross Signs New-Build Resort on Batam Island in Indonesia
 Korean Air Increasing Select Flights to China and Japan
 Air Astana Donates Upcycled Aircraft Furniture to Almaty Airport
 Jetstar Asia Resumes Flights Between Singapore and Clark, Philippines
 Sabre Hospitality to Showcase SynXis Concierge.AI at HITEC 2024
 St. Regis Resort Opens in Al Mouj, Oman
 Percy Muncherji and Ron Cusiter Join Thailand's Centara Hotels and Resorts
 Four Seasons Yachts Unveils Details of More Voyages Planned for 2026
 Sabre to Upgrade Sun Siyam Resorts' Distribution and Retailing Strategy
 Positive Outlook as Asia Pacific Airlines Return to Profitability
 SITA Reports Continued Reduction in Mishandled Baggage by Air Transport Industry
 Scandinavian Airlines Launches Daily Flights Between Copenhagen and Atlanta, USA
 Belgium Orders 17 Airbus H145M Helicopters
 AirAsia Resumes Direct Flights Between Kuala Lumpur and Pattaya, Thailand
 Vietnam Airlines Launches Flights Between Saigon and Manila, Philippines
 Korean Air Selects Air Incheon as Preferred Bidder for Asiana's Freighter Business
 Marriott to Significantly Expand Portfolio of Hotels in France
 Avianca Resumes Eleven International Routes
 IHG Signs First Kimpton Resort in Hawaii
 Laurence Neumann Joins Gran Melia Nha Trang as DOSM
 Frasers Hospitality Expands Sabre Partnership with SynXis Retailing
 IHG Signs Holiday Inn Resort in Kufri, India
 Charles Szar Joins AeroTransCargo as President
 Saudi Arabia's Travel and Tourism Sector Continues to Break Records
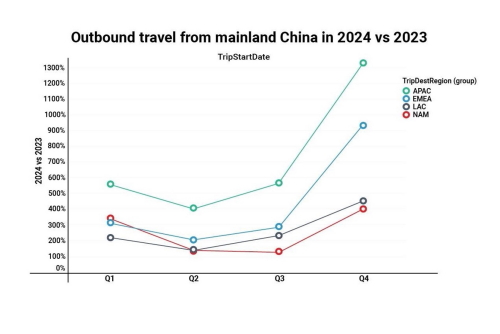 Sabre Market Intelligence Reveals Key Insights into China's Outbound Travel Trends
 Geoff Donaghy, CEO of ICC Sydney, Resigns
 Emirates to Launch Dubai - Seychelles - Madagascar Flights
 Pan Pacific Returns to Jakarta with Tallest Luxury Hotel in the City
 Saudia and Virgin Atlantic Sign Codeshare Agreement
 SalamAir to Launch Flights Between Muscat and Delhi, India
 Radisson to Expand Red Hotel Brand to Bangkok, Thailand
 Plaza Premium Expands Number of Personalised Services at Hong Kong Airport
 Vietnam Airlines Joins IATA CO2 Connect
 Dusit Signs Dual-Branded Hotel and Residences in Phuket, Thailand
 Hong Kong Airlines to Launch Flights to Da Nang, Vietnam
 Singapore University Working with SITA to Upgrade Air Travel Experience
 Germany Orders 38 Airbus H225 Helicopters for Bundespolizei
 AI to Reduce Food Waste at All Mandarin Oriental Hotels Globally
 ITA Airways to Upgrade Network Infrastructure with SITA Connect Go
 Accor to Implement Amadeus' Cloud-Based Central Reservation System
 Gonzalo Aguilar to Join Minor Hotels as CEO - Europe & Americas
 Cathay Pacific and Singapore Airlines to Collaborate on Sustainable Initiatives
 Minor Takes Over Management of Two Hotels in Sri Lanka
 CapitaLand Completes Acquisition of Standard at Columbia Student Accommodation in USA
 Singapore Airlines Renews Slot and Schedule Manager Agreement with Sabre
 Austrian Airlines to Increase Flights to Bangkok, Thailand
 Riyadh Air and Singapore Airlines to Explore Interline Connectivity and More
 Mandarin Oriental Opens Second Hotel in London, England
 Mexicana Orders 20 Embraer E2 Aircraft
 Lufthansa Launches Flights Between Munich and Seattle, USA
 Airbus to Showcase Wingman Concept at ILA Berlin
 Marriott Resort Opens in Lampung, Indonesia
 IndiGo and Japan Airlines Agree to Codeshare
 Ritz-Carlton Reserve Opens on Ummahat Island in Saudi Arabia
 Norse Atlantic Airways Launches Flights Between Athens and New York, USA
 British Airways Opens Refurbished Lounge at Lagos Airport in Nigeria
 Hong Kong Airport Reports Robust Increases in Passenger and Cargo Traffic
 Marriott Opens Luxury Collection Resort in Labuan Bajo, Indonesia
 Dusit Expands Senior Development Team with Two Executive Appointments
 Hong Kong Airlines to Launch Flights to Taichung, Taiwan
 Aviation: RPK Up 11%, ASK Up 9.6 and PLF at 82.4% in April 2024
 Furama to Rebrand Hotel in Sydney, Australia
 IHG Signs Two Crowne Plaza Hotels in Egypt
 IATA Reports Latest Air Cargo Data
 Air Canada Expands Ottawa Network
 Marriott Signs Tribute Portfolio Hotels in Chongqing, Jiande and Xiaoshan, China
 Keishi Spa Swan Valley Relocates to Novotel Perth Murray Street in Australia
 Korean Air's Afforestation Project in Baganuur, Mongolia Celebrates 20th Anniversary
 Etihad Airways Becomes Main Sponsor of Girona FC
 Rolls-Royce Adds Airline Support Baltic to Network of Authorised Service Centers
 Radisson Signs Blu Resort in Ho Tram, Vietnam
 Treamprom Klinhom Joins Moxy Bangkok Ratchaprasong as MarCom Manager
 The Slate Phuket Launches Promotion for Thai Residents
 Airbus to Establish Tech Hub in Japan
 Sabre Embraces Increasing Power of AI to Launch SabreMosaic
 Thailand International Boat Show to Take Place at Phuket Yacht Haven in 2025
 Aeroflot Opens Ticket Sales on Flights Between Krasnoyarsk and Sanya, China
 Norwegian Cruise Line Unveils Details of 24 Port-Intensive Cruises Across Asia
 British Airways to Launch Seasonal Flights to Tromsø, Norway
 SITA Expands Portfolio of Airport Solutions with Materna IPS Acquisition
 United Airlines Takes Wrexham AFC's Recent Success to New Heights
 Peter Tichy Joins Radisson Blu Plaza Bangkok as General Manager
 SMFL LCI Orders 14 Airbus Helicopters
 Apollo Extends Charter Contract with Scandinavian Airlines (SAS)
 Garuda Indonesia and Singapore Airlines Sign FFP and Revenue Sharing Agreements
 Mandarin Oriental Signs Fifth Luxury Hotel in Italy
 Saudia Signs Firm Order for 105 Airbus Aircraft
 IHG Signs Three Resorts in Turks & Caicos
 Plaza Premium Appoints Dr. Syafrina Sharif as Global Head of ESG & Sustainability
 TFE Hotels Launches New Loyalty Program
 The First Collection at Jumeirah Village Circle Joins Marriott's Tribute Portfolio
 Korean Air Partners AWS for AI-Powered Contact Center
 GOLIAT Project to Explore Use of Liquid Hydrogen in Aviation
 Singapore Airlines to Establish a Foundation
 High-Speed Fun in Denmark! HD Video Interview with Aarhus Sea Rangers
 16 Exclusive HD Video Interviews from Routes Europe 2024 in Aarhus, Denmark
 9 Exclusive HD Video Interviews from Routes Asia 2024 in Langkawi, Malaysia
 9 Exclusive Video Interviews with VIPs at ASEAN Tourism Forum 2024 in Vientiane, Laos
 8 NTO Press Conferences from the ASEAN Tourism Forum 2024 in Vientiane, Laos
 13 Exclusive HD Video Interviews with VIPs at World Travel Market 2023 in London, England
 5 HD Video Interviews from APG World Connect 2023 in Monaco, France
 15 Exclusive Videos from Routes World 2023 in Istanbul, Türkiye
 - Interview with Alisa Phanthusak, MD, Tiffany's Show Pattaya, Thailand")

 Central Poland - Interview with Robert Makowski, Commercial Director (CCO)")

, Southampton (SOU) and Aberdeen Airports (ABZ) - Interview with Christopher Tibbett, Aviation Director")

 in Denmark - Interview with Lotta Sandsgaard, CEO, at Routes Europe 2024")


 - Interview with Prof. Dr. Martin Roll, CEO, at Routes Europe 2024")
 - Interview with Michiel Parent, Commercial Director")
 - Interview with Marc Watkins, RDM")
 in Estonia - Interview with Eero Pärgmäe Board Member and CCO")
 - Interview with Gary Cobb, Airport Director")


 in Western Australia - Interview with Stephanie Juszkiewicz, SVP Aviation Business Development, at Routes Asia 2024 in Langkawi, Malaysia")
 Rayong / Pattaya, Thailand - Interview with Ampika Chadawong, at Routes Asia 2024 in Langkawi, Malaysia")
 in Nha Trang, Vietnam - Interview with Le Thi Hong Minh at Routes Asia 2024 in Langkawi, Malaysia")


 - Interview with Simon Miller, Senior Manager Market Intelligence, at Routes Asia 2024 in Langkawi, Malaysia")


 at ATF 2024")


 2024 in Vientiane, Laos")


 to Rebrand as DTH Travel - HD Video Interview with Stephan Roemer, Partner and Group CEO")

 - HD Video Interview with Rohan A. Khaunte, Minister for Tourism at WTMLDN 2023")

 Tourism - Interview with Prateek Hira, President & CEO of Tornos, at WTMLDN 2023")

 - Interview with Sheo Shekhar Shukla, Principal Secretary Culture & Tourism, at WTMLDN 2023")
 - Interview with Dr. Rashmi Sharma, Director - Department of Tourism, at WTMLDN 2023")
 2023")


.")


 of Malaysia Tourism Promotion Board (MTPB), at Routes World 2023 in Istanbul, Turkiye.")
 at Routes World 2023 in Istanbul, Turkiye.")

 - Interview with Ulla Lettijeff, SVP and Director (Finavia), at Routes World 2023")
 New Satellite Terminal - Airports of Thailand Interview with Paweena Jariyathitipong, Senior Executive Vice President (Engineering and Construction), by Steven Howard of TravelNewsAsia.com on 15 October 2023 at Routes World 2023 in Istanbul, Turkiye.")

 - Interview with Qiang Wang, Deputy GM Aviation Business, at Routes World 2023")


 in Kazakhstan - Exclusive Video Interview with Co-Founder, Auez Tulegenov")


")


, Hua Hin (หัวหิน), Prachuap Khiri Khan (ประจวบคีรีขันธ์), Cha-Am (ชะอำ) and Petchaburi (เพชรบุรี), to those living in Thailand as well as regional travellers and businesses.")
 has been described as 'an important enabler of Sabre’s vision for personalized travel'. But what exactly is NDC, and what role does Sabre play in its development and future growth? Those are just two of the questions that Steven Howard of TravelNewsAsia.com asks Kathy Morgan, Vice President - Offer Sourcing at Sabre Travel Solutions.")
 Conservation, Jungle Bubbles and Tourism in Thailand - Interview with John Roberts of the Golden Triangle Asian Elephant Foundation (GTAEF)")


 - State of the Industry 2020 with Subhas Menon, Director General")
, Thailand's Deputy Prime Minister and the Minister of Public Health and Dr. Tanarak Plipat, Deputy Director General of Thailand's Department of Disease Control speaking at the World Health Organisation's (WHO) COVID19 virtual press conference on 6 November 2020")


 does, as well as how the year 2019 ended and what they have planned for 2020. John tells us what Jungle Bubbles are, who is staying in them, how many elephants people can expect to see, whether they are safe, and how they plan to expand this rather unusual idea. All that and much, much more in the interview.")


 2020. Filmed at TAT's office in London on 8 January 2020, Khun Chiravadee tells us when and where TTM+ 2020 will take place, why that city was chosen, what the theme will be this year, and how many buyers and sellers are expected to attend. Khun Chiravadee tells us how many buyers from the UK will be going and how those buyers will be chosen, and much, much more.")


. Yanik tells us how the certification levels within NDC, such as Level 4 and @scale, differ from one another, why they are important, what needs to be done to go from one level to another, and so very much more.")

 in Bangkok, Steven Howard of TravelNewsAsia.com asks Robert to give us an update on the company, NDC, NGS and the industry in general.")


 Yangsuksathaporn, General Manager of the Vince Hotel Bangkok Pratunam. In this interview, filmed in the rooftop bar of the hotel on 1 November 2019, Khun Fah tells us about the location of the Vince Hotel Bangkok Pratunam, where the hotel's guests are coming from, how 2019 compares to 2018, what its USPs are, where all the creative ideas come from, which other events the hotel will attend this year, what guests can expect from the property and what plans they have for 2020. All that and much, much more in the FHD video and podcast.")


, Siem Reap (REP) and Sihanouk (KOS), how this year compares to last year, and what expansion plans they have for the future.")


, the Group Director - Travel Industry for Cape & Kantary Hotels, to ask him about the event and the company's plans for the future. In this exclusive interview, filmed at the Cape Panwa Hotel on 21 July 2019, Khun Tom tells us about three new properties the hotel group plans to open in the next few years, how they will be branded, where they will be located, and how many rooms each will have.")


 and has attended the last nine, including the most recent edition in Jomtien, Pattaya last week. In this exclusive interview, filmed on the first day of TTM+ 2019, Kati Hakkinen explains where Khanom is in Thailand, what its attraction is and what is the best way to travel there.")

 2019 in Pattaya. Steven Howard of TravelNewsAsia.com sat down with Khun Sillapat Watcharapong, Director of Marketing at the Racha Kiri Resort in Khanom, to ask him about his resort and Khanom as a destination.")

 2019, held in Jomtien, Pattaya last week, not only had the crucial buyers meet sellers component, but also different workshops with expert speakers sharing their knowledge with media and sellers alike. One such expert, Khun Arrut Navaraj, Managing Director of Suan Sampran, gave an interesting talk to delegates about Organic Farming and Sustainable Tourism.")
 in Pattaya. Mr. Tanes Petsuwan, TAT's Deputy Governor for Marketing Communications, used the media briefing to outline their plans for 2019 and beyond, and give some insight into which of Thailand's less well known destinations they will be promoting and how. This video includes the Q&A at the end.")

, in Halong, Vietnam on 26 May 2019.")


 as Miss USA. In this interview, filmed on 7 March 2019, Steven Howard asks Jazell why she has come so far to compete and why she chose Miss International Queen above all the others.")


, Managing Director of Phuket-based Sky Marine Group. In this interview, filmed at the Ocean Marina Pattaya Boat Show on 2 December 2018, Steven Howard asks Khun Thanaya about her business which includes yacht sales, hull cleaning and maintenance, as well as luxury yacht charters.")

 Song, Managing Vice President Passenger Network & Sales about the airline and its plans for the future.")

 62nd Assembly of Presidents.")


 and Sustainable Tourism - PHIST Interview. What could the World Wide Fund for Nature, or WWF as it is more commonly known, possibly have in common with the hotel industry? In this exclusive interview with Maggie Lee, Market Transformation Manager at WWF Singapore, we ask Maggie about this, and much more.")
 season and the peak November - May season.")


 forum which was held at the resort on 24 September.")


 in London.")
 at Farnborough Airshow 2018 on 16 July, Steven Howard of TravelNewsAsia.com asks Mr. Gauss about the aircraft, why it is so popular, what makes it special and what plans they have for future orders.")


 Province, Thailand.")